Data to empower your Next.js development

NexTrace is a VSCode extension that helps Next.js developers identify network request performance bottlenecks and monitor console logs in real time. It makes debugging Next.js applications quick and easy.
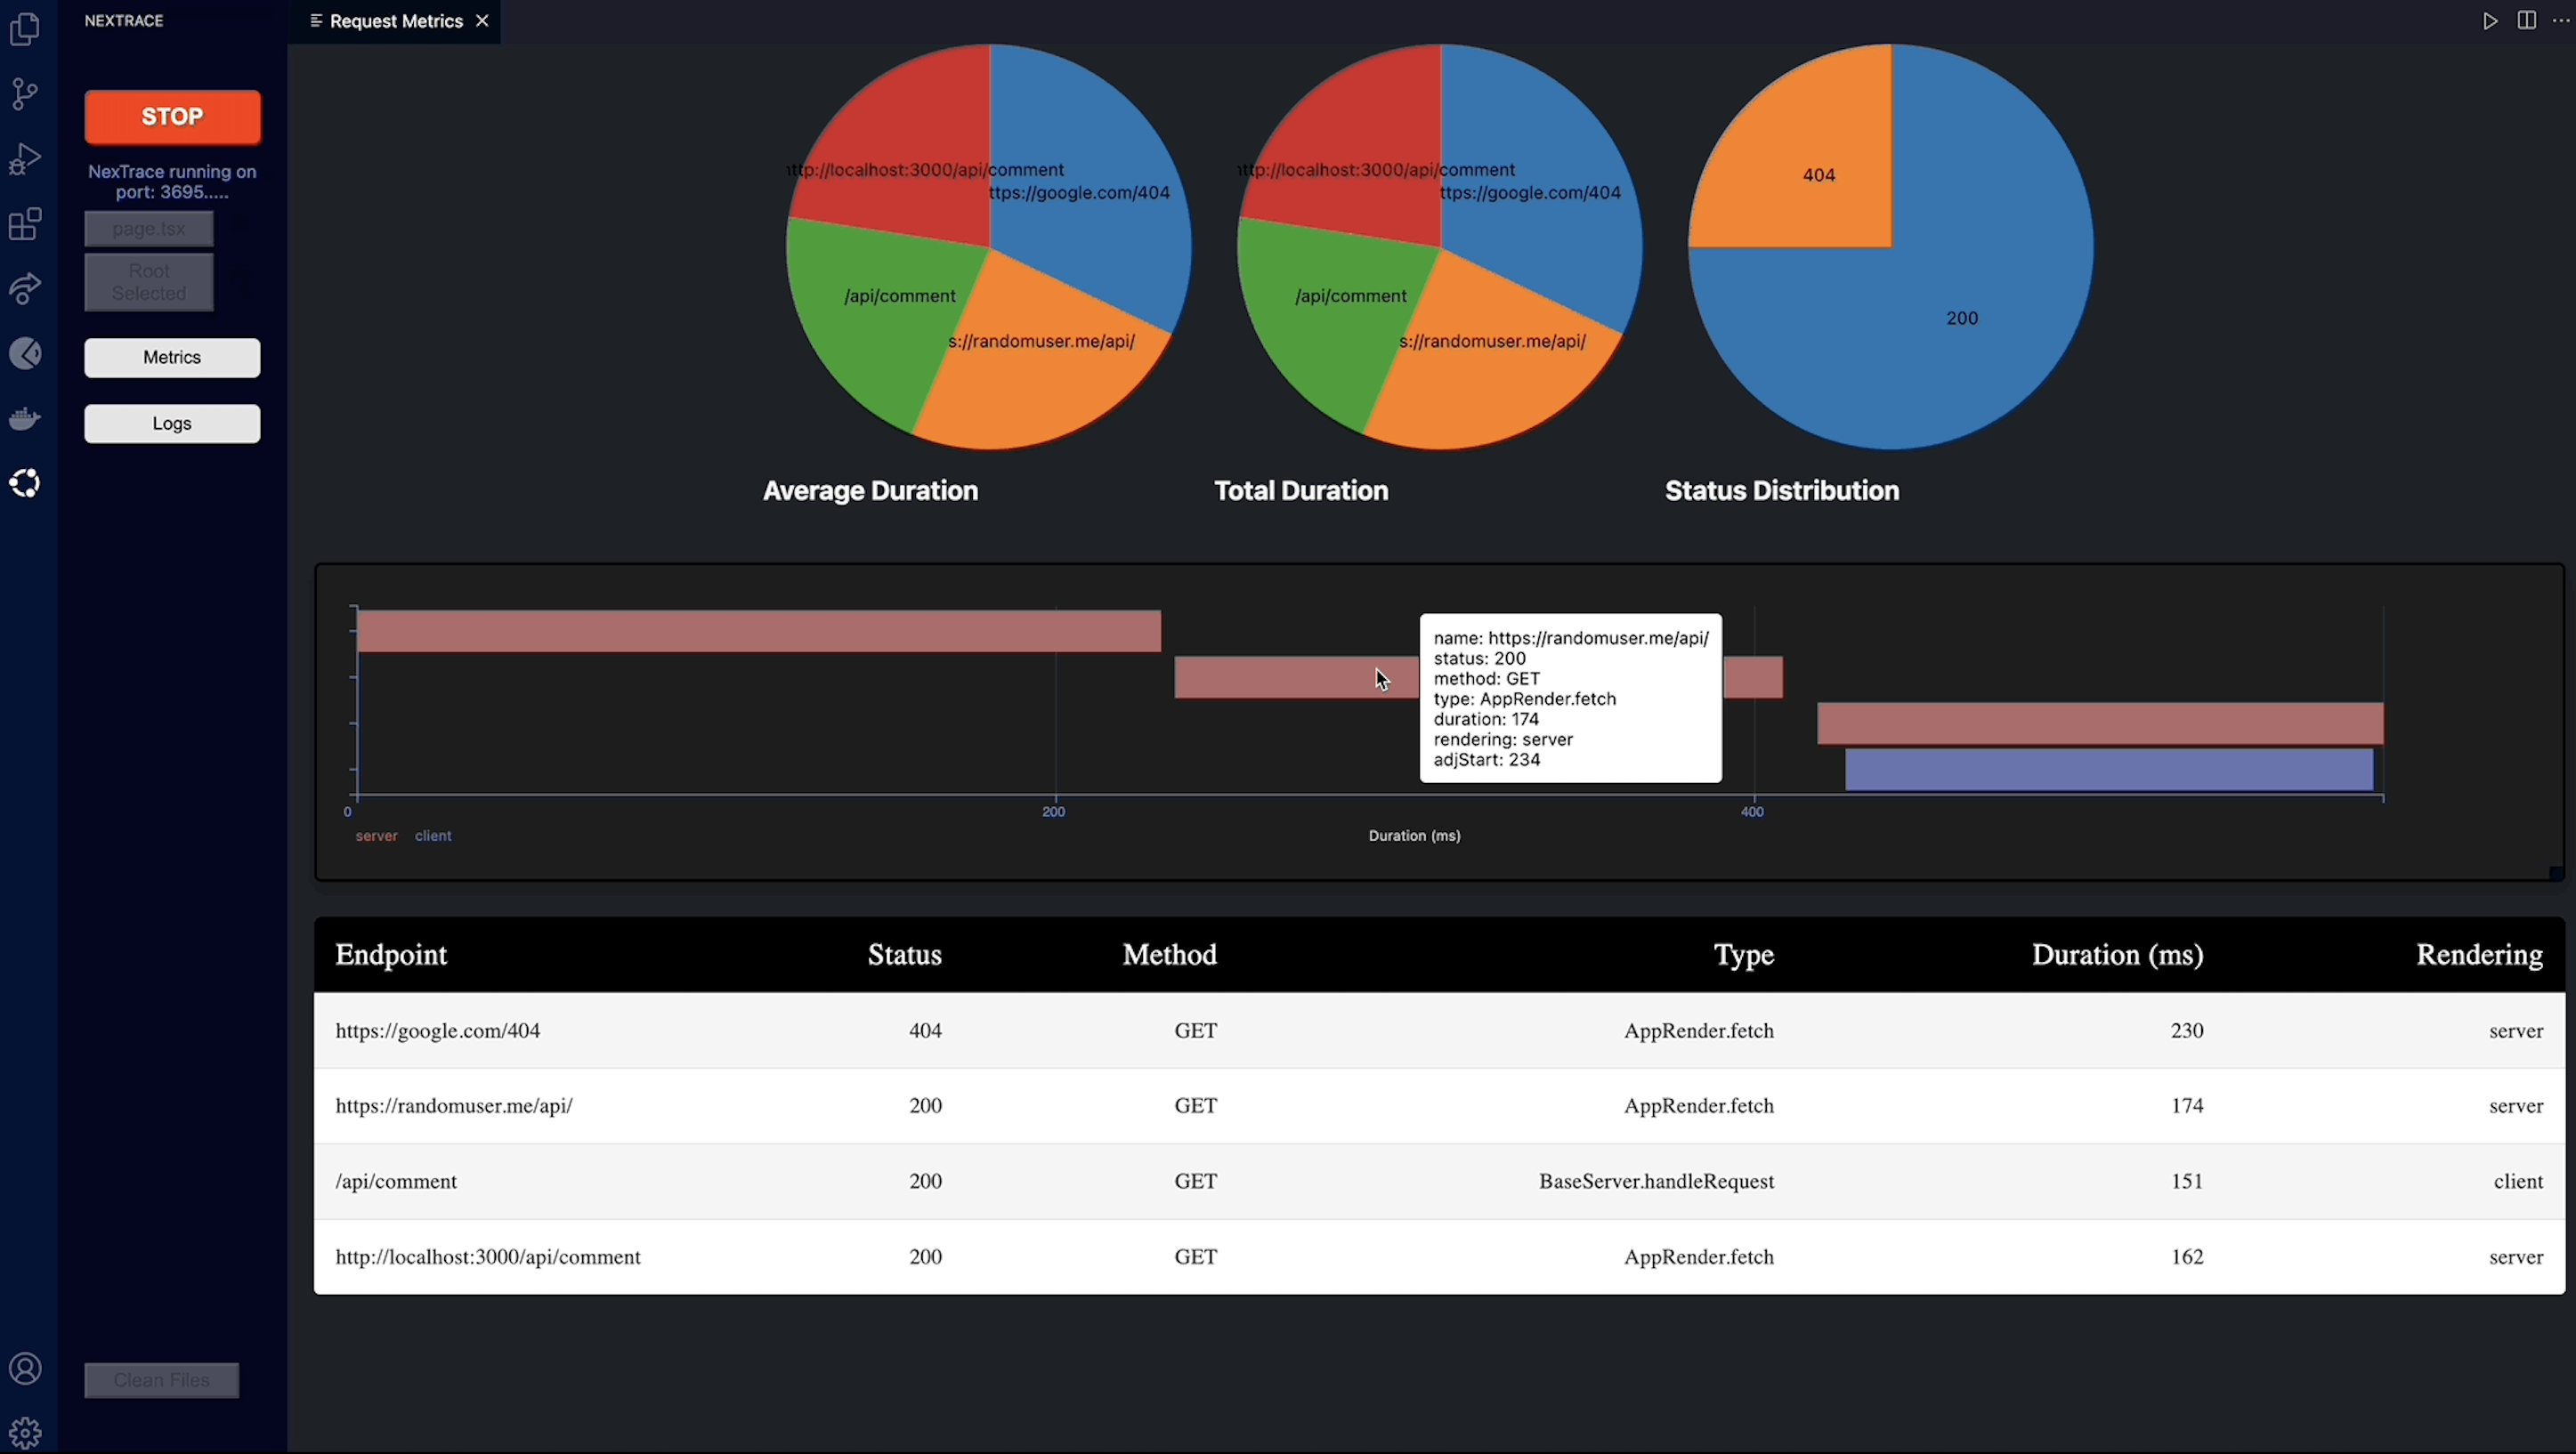
Get StartedDownload From Store Statamic
table

Metrics Demo

App screenshot
Step 1
Click on the NexTrace logo in the sidepanel.
Step 2
Click 'Choose File' and select the entry point to your Next.js application.
Step 3
Click 'Choose Root' and select your app folder. (note: this folder should not be your project folder as it contains node_modules containing a large number of files. Instead select your app folder containing the entry point of your application)
Step 4
After starting your Next.js application, click 'Start' to begin tracking your application's network requests.
Step 5
Click 'Logs' to display your console logs and file navigation buttons.
Step 6
When finished, click 'Stop'.

Instant Console Log Navigation Tool

This tool offers real-time console log display and instant navigation for easier debugging of client and server-side code.

Demo2 gif
1
Real-time monitoring of console logs for quick issue identification.
2
Instant single-click navigation to log-related code, enhancing debugging efficiency.
3
Seamlessly supports both client and server-side log rendering, simplifying troubleshooting across the application.

Technologies

ReformTupleStatamicStatamicStatamicStatamicStatamic

Meet our team